


|
You can examine various aspects of the MIDlet applications you created with the J2ME Wireless Toolkit to identify where you can improve the efficiency and speed of your MIDlet. The Wireless Toolkit includes the following features that enable you to optimize the performance of your MIDlet:
You can examine the method execution time with the Profiler utility. The Profiler collects data from an emulator during runtime. By seeing how much time a method takes to execute, you can see where potential problems, such as bottlenecks, might exist in the application.
The Profiler window displays two types of method information:
To obtain profiling information, follow these steps:
(Optional) Check Show System Classes if you want to display the system classes. If unchecked, most system classes are hidden and ignored. Some system classes might be left visible to highlight lengthy execution time. Hiding the system class information helps you to see application class-specific information. You should hide the system classes information while you are developing your application.
When you quit the application, the Profiler window opens displaying information collected during execution.
In the Call Graph tree, you see folders for top-level methods. Opening a method’s folder displays the methods called by it. Selecting a method in the tree shows the profiling information for it and all the methods called by it. Selecting <root> displays profiling information for all methods in the program.
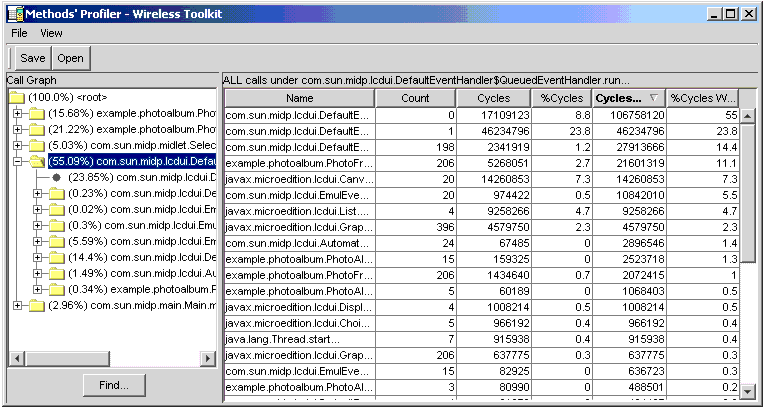
The table displays rows of methods. For each method, you can see its:
Click on the column titles in the table to sort the display. Clicking on Name sorts the methods in alphabetical order. Clicking Count, Cycles, %Cycles, Count with Children, or %Count with Children sorts the information in ascending order. Clicking on the column title again resorts the information in descending order.
You can save profiling information in two ways:
To save profiling information so you can it examine later using the Profiler:
To save the data and examine it with an external tool:
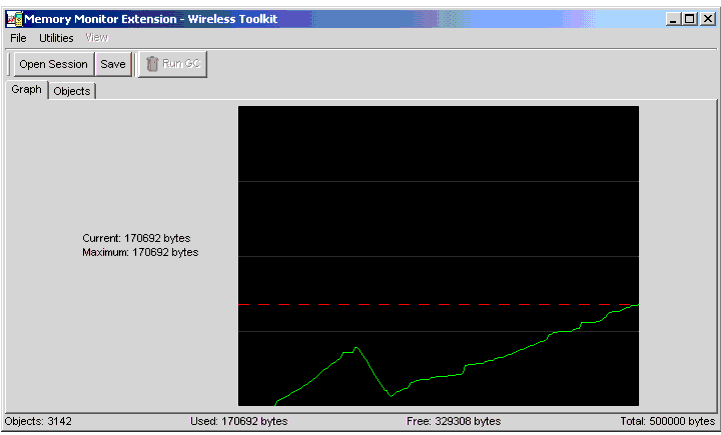
Another area to check for optimization is memory usage. The Memory Monitor Extension feature enables you to see how much memory is used by your application during runtime and to see a breakdown of the amount of memory usage per object.
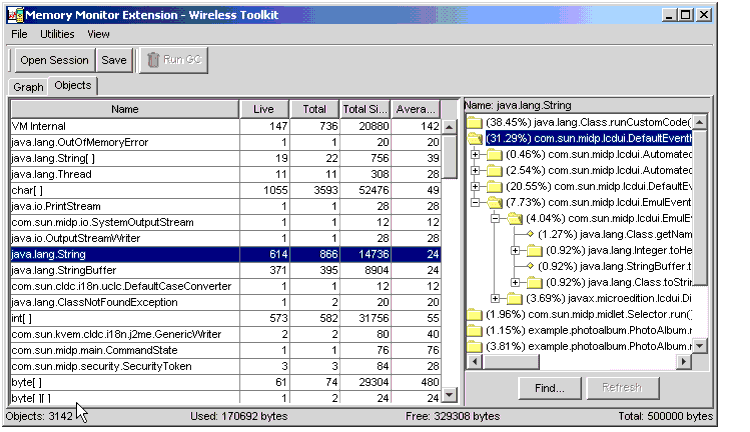
To obtain memory usage information, follow these steps:
(Optional) If you want to set the heap size, click the Storage tab in the Preferences dialog box and enter a value. Setting the heap size is not required to use memory monitoring.
(Optional) If you want to determine the required amount of memory during runtime, turn on Excessive GC mode. When turned on, garbage collection is run every time an object is about to be allocated.
(Optional) Click Run GC in the Memory Monitor Extension window to have garbage collection performed at anytime while the application is running.
The Memory Monitor displays usage information in two tabbed panes:
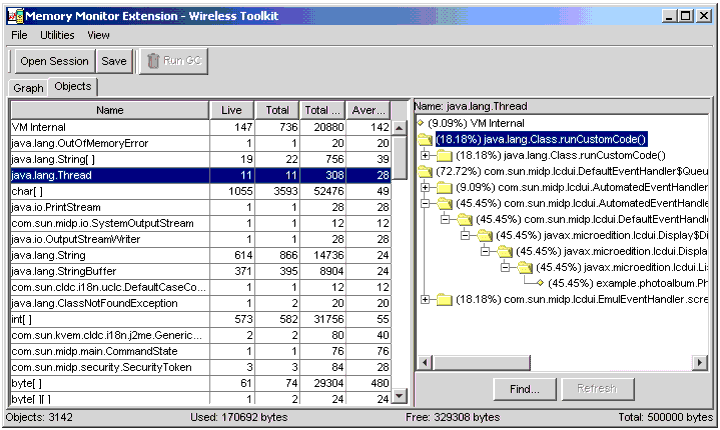
Click on the column titles in the table to sort the display. Clicking on Name sorts the classes in alphabetical order. Clicking Live, Total, Total Size, or Average Size sorts the information in that column from ascending to descending value.
Selecting a class in the Name column displays a hierarchical list of that class’ methods and the percentage of memory used by the objects allocated by that method and the methods called by it in the pane to the right of the table. Click Find to locate a specific method. The Objects table is dynamically updated during program execution; however, the method list is not. Click Refresh to update the display of percentage of usage information.
You can save memory usage information and examine it later by:
To examine previously saved information from the KToolbar:
One of the many uses of a MIDP application is to get or send information. By monitoring the network traffic generated by your application, you can obtain information you might need to improve or fix communication with a server and optimize network usage. The Network Monitor enables you to monitor the following network protocols:
Demonstration applications for the following network protocols are available from the Open Project dialog box:
demos application.NetworkDemo application.SMSDemo application.To turn on network monitoring automatically when your application runs or to choose a specific proxy type, follow these steps:
The Network Monitor displays a list of messages that were sent or received by the application. Messages are broken down into their header and body, if any.
To see information for a specific message:
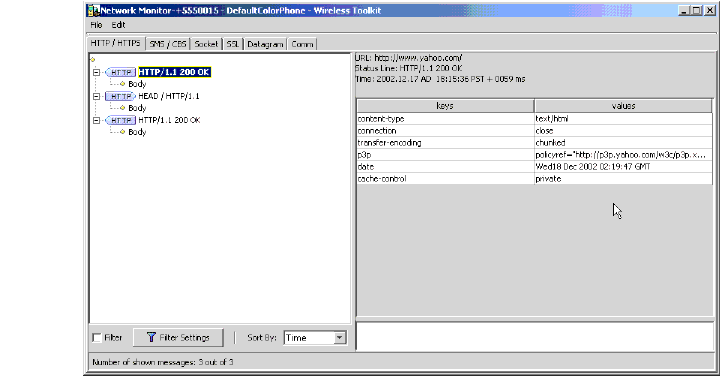
An asterisk (*) in the protocol tab indicates which network protocol has information to display if it is not the selected tab.
The field summary, shown in the right panel of the monitor. All protocols have a URL field. Depending on the protocol, the URL field can contain, for example, URL address, protocol, baud rate, hostname, phone number, and port number.
The properties of a message are displayed in key and value pairs in a table format. You can view the entire contents of a value by choosing that value and viewing it in the scrollable text field at the bottom of the pane.
To see the message body:
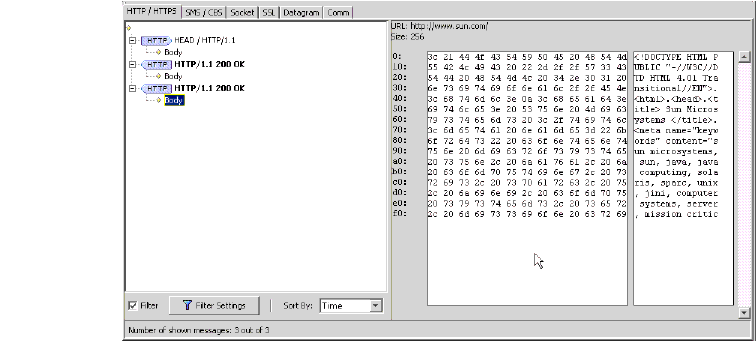
You can reorganize or narrow the messages displayed by setting filters or by sorting message by type. See the sections, "Filtering Messages" ” and "Sorting Messages" .
To examine a specific set of messages, you can set filters in the Network Monitor. Only those messages that fall within the filter settings are displayed in the message tree. Filter Settings are specific to the network protocol used.
To disable message filtering so that all messages are displayed:
To arrange the messages in the message tree in a particular order:
Sorting parameters are dependent on the message protocol you choose. For instance, sorting by time is not relevant for message using the Socket protocol.
You can save information about a networking session and examine it later by:
To examine previously saved message information from the KToolbar:
To remove the list of message in the message tree:
If the application you develop has a graphical user interface (GUI), the time required to draw the GUI on the screen is critical to the overall usability of the application. Another critical time factor is knowing the speed at which your application runs on a device. The VM emulation speed approximates the slower running speed of an application on a device. How quickly an application is able to transmit information to the network is another performance factor The Wireless Toolkit lets you modify both graphic speed emulation, VM speed emulation, and the speed of the network throughput.
The intent of the speed emulation features is to enable you to scale down the performance of some of the emulator subsystems to better reflect performance on a real device. Developing the application in a slower performance environment enables you to monitor and optimize the code of low-end devices. It is not the purpose of the speed emulation features to accurately emulate a specific device.
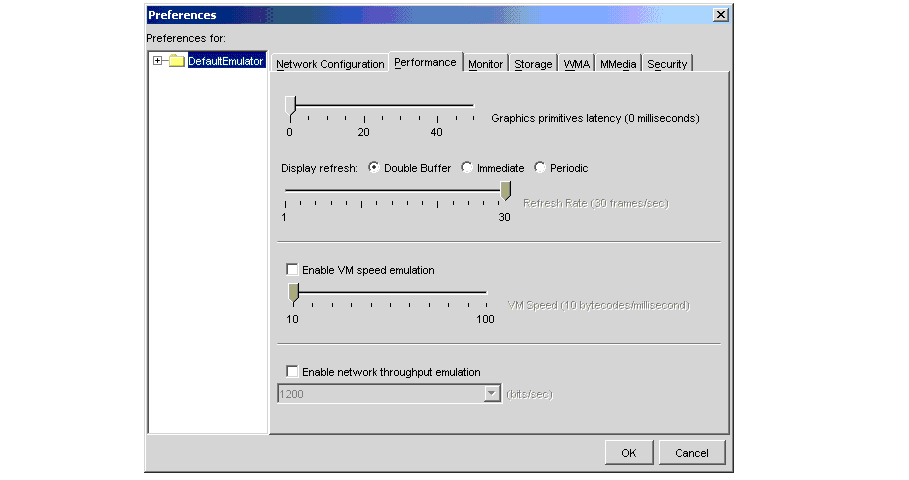
To optimize GUI display capabilities, you should adjust both the Graphics primitive latency speed and the Refresh mode:
Graphics primitive latency. The span of time in milliseconds for a graphic element to appear once the request is sent.
Display refresh mode. The number of times per second a device’s screen is updated. There are three refresh modes:
Vary the settings to find the ones that produce the fastest rendering with the least amount of flickering in your application.
When running an emulation of a MIDlet, you cannot get an accurate demonstration of real time application execution speed. The emulation runs much faster than an application on an actual device. You can, however, adjust the VM speed emulation in the Wireless Toolkit to approximate the slower speed of a device on which the application might run.
To set the VM speed emulation, which is the amount of Java byte code that is executed per second:
Sometimes an application’s performance is hindered by the speed of the network. To see how your application performs on a slow network, you can vary the network speed parameter. To set the rate at which the application transmits information to the network:


|
User's Guide Java™ 2 Platform, Micro Edition, Wireless Toolkit, Version 2.1 |
Copyright © 2003 Sun Microsystems, Inc. All rights reserved.